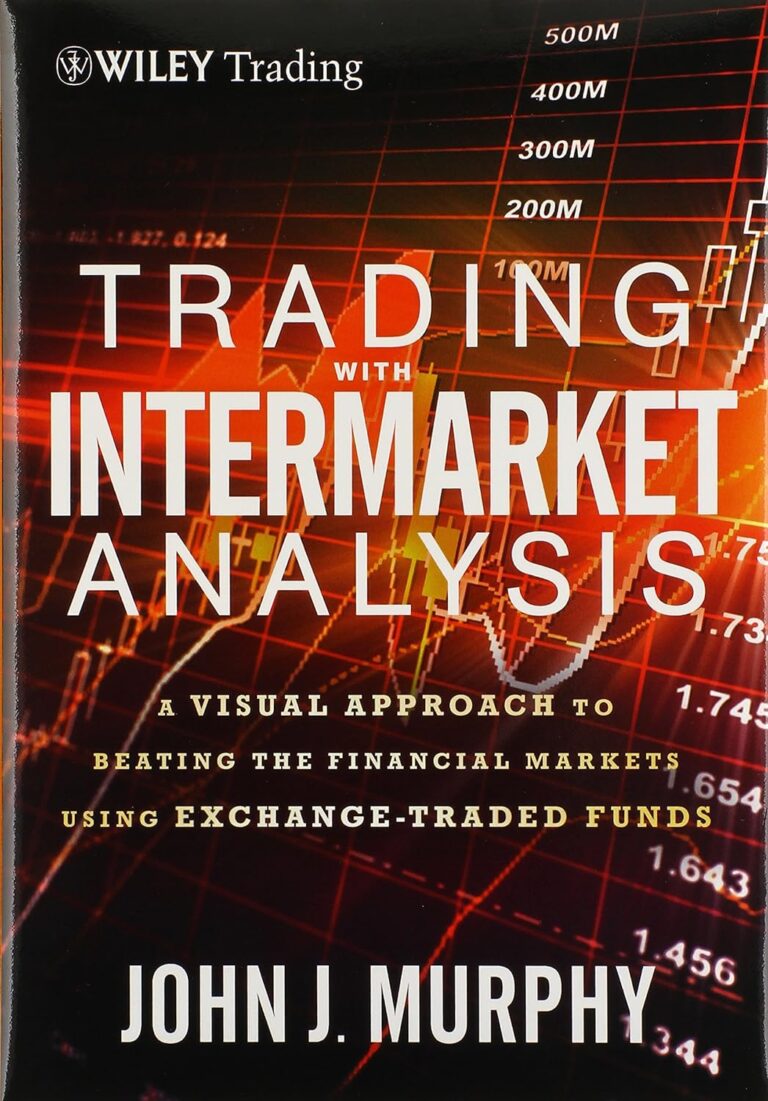
Intermarket analysis is the study of how various markets are interconnected. In the past, stock brokers didn’t pay much attention to what was happening with the dollar or commodities.
Similarly, commodity traders weren’t concerned with other markets; their focus was solely on the market they were trading in. Over time, correlations between markets were observed, as all markets are somehow related.
For example, stocks and fixed-income securities tend to move in opposite directions. Bitcoin tends to move in line with the S&P 500, the most important stock index in the United States and the world.
So even cryptocurrencies, representing a new digital economy, are intertwined with other markets. In this article, we’ll delve into an introduction to intermarket analysis. My reference is John Murphy’s book, “Trading with Intermarket Analysis.”
Opportunity Cost of Capital
The economy is interconnected, and money is always seeking the best opportunity at the moment. If fixed-income investments are performing well, money flees from risk, and you clearly see a decline in stocks. But if you check your fixed-income investments and see they’re not yielding much, you’ll start looking elsewhere to invest that money, perhaps turning to stocks.
Even if you trade in just one market, such as a trader specialized in mini-dollars, intermarket analysis gives you an advantage over traders who don’t use it. Intermarket analysis also aids in asset allocation. I could assemble a portfolio with 50 different assets, but it may not necessarily be diversified without conducting intermarket analysis. I might have purchased 50 highly correlated assets, meaning, in practice, I wouldn’t have diversified.
Before continuing this explanation, I want to invite you to trade and invest with BTG Pactual, our partner. It’s the safest place to keep our money in Brazil and best serves both traders and investors. You can open your account for free here.
Indices, Dollar, and Oil
Here, we have the weekly candlestick chart of the dollar index, the DXY, which compares the dollar against a basket of developed countries. The orange line represents the S&P 500. Now, let’s look at the relationship between the S&P 500 and the most important global commodity, oil.
{spy vs UKOIL}
The candlestick chart depicts the weekly S&P 500, and the orange line represents Brent crude oil, the most significant type of oil. There’s an article here explaining more.
Notice at the beginning of 2022 when oil prices surged; did this signal a peak in stocks? As John Murphy himself states early in the book, rising oil prices precede a stock market slowdown.
Rising oil prices have contributed to all economic recessions in the United States in recent decades. And it has also, obviously, contributed to market tops signaling the beginning of a bear market. Let’s see what happened in the 2008 crisis and how these two charts behaved. If rising oil prices drag down stocks, then the opposite is also true: a sharp drop in oil prices tends to result in a rise in stocks. John Murphy says our intermarket analysis should always consider what oil prices are doing. Note that rising oil prices typically precede stock market tops. This is the type of lesson you need to watch twice; take a look at my video on this for a better understanding.
Predictive Power of Technical Analysis
The advantage of using charts in intermarket analysis is that the price is a discount mechanism, so the entire economy is embedded here. I don’t need to be an economist if I can read a chart.
John Murphy says technical analysis is a shortcut for fundamental analysis. We can see the beginning of a recession before economists and even before the Federal Reserve; we’ll see information on the chart that points to the onset of a recession, such as a lower peak than the previous peak, divergent volume, and broken trendlines.
Lower Interest Rates are Better for Stocks
Earlier in the article, I mentioned the relationship between cryptocurrencies and the S&P 500. For those wondering why cryptocurrencies rise with stocks, just remember that money either seeks or flees from risk, depending on macroeconomic circumstances: if central banks are lowering interest rates, fixed-income assets become less attractive, and money starts seeking risk, flowing into stocks, cryptocurrencies, or any financial instrument benefiting from falling interest rates.
And if it’s worth leaving money earning interest, there’s less incentive to hold bitcoin or stocks; so most of the time, these markets will be moving in the same direction.
Intermarket Analysis Adds to Technicals
On page 11 of John Murphy’s book, “Trading with Intermarket Analysis,” he says the biggest contribution of intermarket analysis is that it enhances the peripheral view of market transactions for the market analyst.
Trying to transact between markets without knowledge of intermarkets is like driving a car without looking at the rearview mirror and windows. Intermarket analysis includes all markets worldwide. He goes on to say that intermarket analysis provides a more unified view of global market behavior. Intermarket analysis doesn’t replace traditional technical analysis; it simply adds another dimension.
Technical analysis discounts other informations
The magic of technical analysis is that it can be applied in any market and already discounts all information; that’s why TA is the best way to perform intermarket analysis. Economic data is already discounted; everything is embedded in the price, making it easier for us to buy two, three, or four markets.
Simply overlaying one chart on top of another or dividing the screen in half and looking at the two side by side. It’s worth mentioning that I use TradingView only for teaching purposes. If you want to trade for real and place buy and sell orders, the recommended platform is Profitchart Pro, connected to the BTG Pactual brokerage, with free registration.
I also have this lesson in video format on YouTube and its continuation, part 2, covering John Murphy’s 15 tips for trading with intermarket analysis.
-> Check out the video:
>> See also:

