The incredible journey of technical analysis dates back centuries to the early days of financial markets. Although its history is little known to many, its evolution is fascinating and full of developments that have shaped what we know today.
It is believed that the foundations of technical analysis were developed in Japan around the 17th century by the rice traders of Osaka. They used price charts and candlestick patterns to predict future movements in rice prices, one of the most traded commodities at the time. These early methods were refined over time and eventually gave rise to the candlestick patterns that are still widely used in technical analysis today.
In the West, technical analysis began to gain popularity in the late 19th and early 20th centuries, with the work of analysts and traders like Charles Dow and William Peter Hamilton. Dow is known for developing Dow Theory, which postulates that the market moves in short, medium, and long-term trends. Hamilton, in turn, applied Dow’s principles to analyze the stock market and identify price behavior patterns.
Throughout the 20th century, technical analysis continued to develop and evolve, with the emergence of new techniques and tools. The introduction of computers and the internet revolutionized technical analysis, making it more accessible and allowing for the development of sophisticated software and algorithms for data analysis.
Today, technical analysis is widely used by traders and investors around the world in various markets, including stocks, forex, commodities, and cryptocurrencies. It offers a way to understand and anticipate price movements based on trading history and patterns observed in price charts.
Although there are debates about the effectiveness of technical analysis in predicting price movements, its appeal remains in its simplicity and ability to provide quick insights into market direction. For many, technical analysis represents a valuable tool in their trading toolbox, allowing them to make informed and potentially profitable decisions in the financial market.

De La Vega’s Psychology of Business
Joseph de la Vega’s work in Amsterdam in 1688 marked a significant milestone in understanding the psychology behind business dealings. His book provided insights into trading strategies, investor emotions, and early price forecasting techniques. Additionally, de la Vega identified key market biases, such as herd behavior, overconfidence, and loss aversion.
This publication represented one of the earliest attempts to comprehend the psychology of both buyers and sellers in financial markets. Furthermore, it served as one of the initial accounts of speculation with financial assets. De la Vega’s observations laid the foundation for the study of behavioral finance, a field that continues to explore the psychological factors influencing financial decision-making to this day.
Munehisa’s Invention
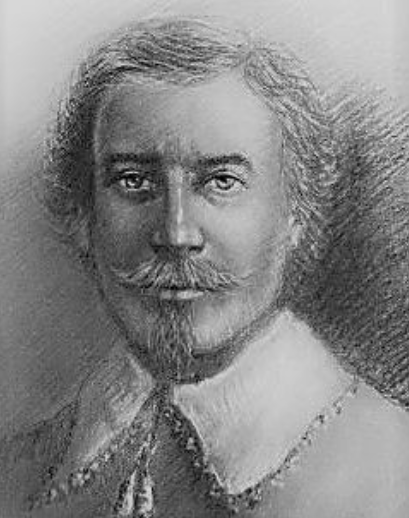
In the Japan of the Edo period, lived Munehisa Homma, a rice trader credited with the invention of candlestick charts. It was in 1710 when rice futures contracts emerged, and candlestick charts were utilized to record opening, closing, high, and low prices.
Munehisa Homma’s innovation propelled him to great success, leading to his appointment as a financial advisor to the emperor and later earning him the title of Samurai. He also authored books delving into candlestick patterns and market psychology, such as “The Fountain of Gold” in 1755. Homma’s contributions laid the groundwork for modern technical analysis and continue to influence traders and investors worldwide.

The Candlestick’s Ascension
Over time, the concept of candlestick charts has been refined, and over the past 30 years, it has become the most popular type of chart in technical analysis, replacing bar charts as candlestick readings allow for quick identification of patterns and price movements.
Candlestick charting gained popularity outside Japan only in recent decades, primarily due to Steve Nison’s 1991 work, the book “Japanese Candlestick Charting Techniques.”
Before Nison’s book, the most commonly used chart types were bar charts or point and figure charts. However, it was the candlestick chart that offered a more intuitive visual representation, quickly gaining popularity among traders of various assets.
Charles Dow and the Surging
Let’s now move forward another century to the 1890s, during the golden age of Wall Street, when technical analysis emerged as we know it today, and it didn’t originate from economists but rather from finance journalists in New York.
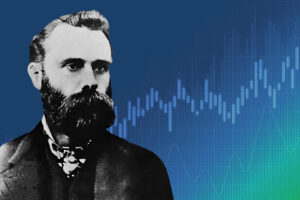
Charles Henry Dow is the most iconic figure in the emergence of technical analysis. Although he did not specifically use this term and did not explicitly recommend that his principles be used to trade assets, his more than 250 editorials became the foundation for the development of this discipline.
Dow was a co-founder of The Wall Street Journal, and in 1896, he created the world’s first stock index, the Dow Jones Industrial Average. To compile the data that make up the index, he recorded the highest and lowest points of daily, weekly, and monthly averages and related these patterns to market flows.
He then published articles identifying recurring patterns and describing price movements. Some of Charles Dow’s formulations form the pillars of modern technical analysis, such as:
– Prices already reflect all relevant market information; or prices discount everything except acts of God like a tsunami or a hurricane.
– Markets move in trends.
– A trader should be able to identify the market trend by observing price alone.
– We should assume that the current trend will continue until there is a clear signal of reversal.
– Trading volume should confirm the trend.
William Hamilton: Practical Application
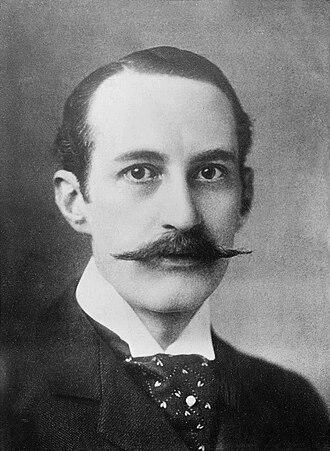
With Dow’s premature death at the age of 51 in 1902, his colleagues at the Wall Street Journal were responsible for carrying forward his studies, especially William Hamilton, who succeeded Charles Dow as editor of the Wall Street Journal for over 20 years, from 1908 until 1929.
Hamilton refined and popularized Dow’s theory, and his work provided a more practical application of technical analysis to identify market highs and lows, even warning of the 1929 crash in that same year.
Robert Rhea and the First Indicators
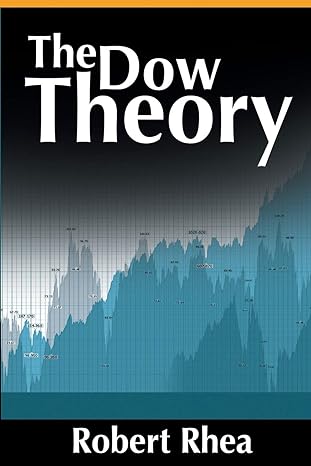
Another significant technical analyst who pioneered the application of Dow’s principles in practice was Robert Rhea, who in 1932 published “The Dow Theory,” where he developed practical ways to identify ‘confirmation lines’ or ‘reversal points’ of the trend, using trading volume for confirmation.
After predicting the market bottom in 1932 and a top in 1937, Rhea’s investment newsletter, the “Dow Theory Comments,” gained thousands of new subscribers who made fortunes following his calls, earning him respect and admiration from traders of the time.
The principles of Charles Dow provided the foundation of technical analysis that we use to this day. William Hamilton developed this base, and Robert Rhea created practical indicators to apply these principles to buying and selling decisions.
Richard Wyckoff: Enrich with Volume
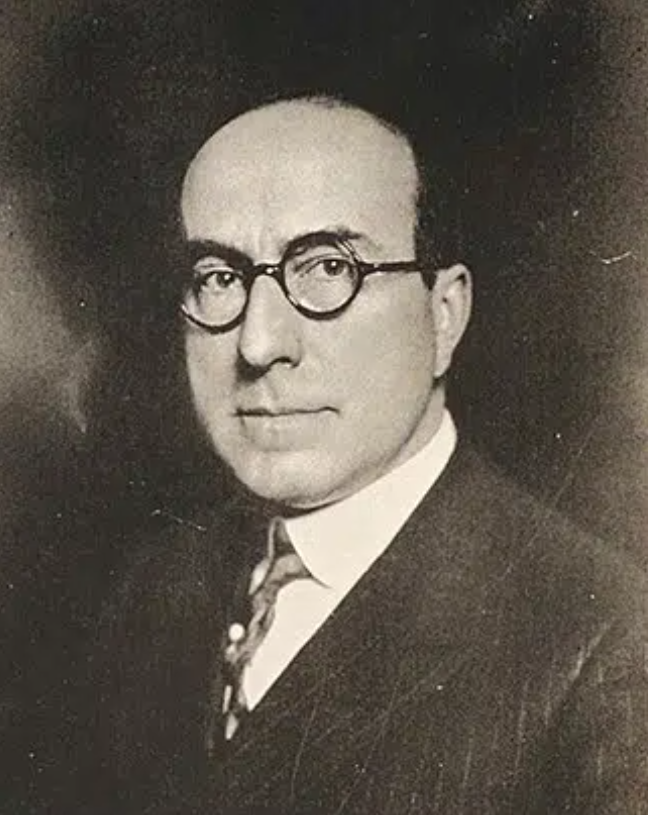
The fourth pioneer we must remember is Richard Wyckoff, who began as a broker on the New York Stock Exchange in the early 20th century, founded and edited the ‘Magazine of Wall Street,’ and amassed such a fortune through trading that he bought the mansion next to that of the president of General Motors, one of the wealthiest magnates of the time.
After becoming wealthy, Wyckoff dedicated himself to teaching technical analysis and publishing his conversations with the greatest traders of the time, such as Jesse Livermore and J. P. Morgan.
The Wyckoff Method emphasizes reading volume to identify the activity of major players and market reversals, advocating for stop-loss and risk control as mandatory in any operation. Volume precedes price in a cause-and-effect relationship and can be read through indicators such as Volume at Price, OBV, or the volume itself.
Ralph Nelson Elliott: Waves and Fractals
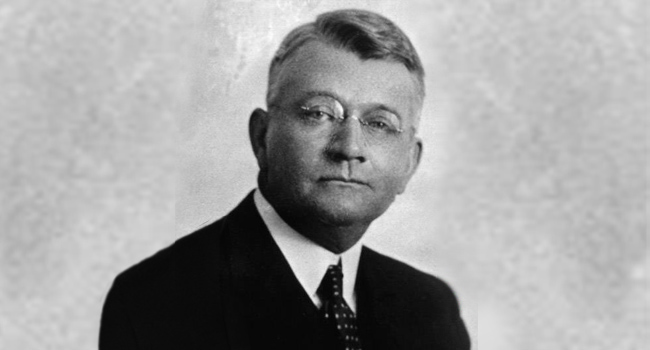
At this time, the accountant Ralph Nelson Elliott was also in action. After many years of researching the stock market, he created the Elliott Wave Theory, which describes asset prices following recurring patterns, such as waves, reflecting the collective psychology of investors. Due to the fractal nature of the market, these principles can be applied across all investment horizons.
In 1946, Elliott published his final work, “Nature’s Law – The Secret of the Universe,” in which he defines that the stock market follows the laws of nature and can be estimated using Fibonacci numbers.
With this, we reach the middle of the 20th century. By this point, the five founding fathers of technical analysis had passed away, but their legacy would continue to grow.
Gould and Magee: The First Traders
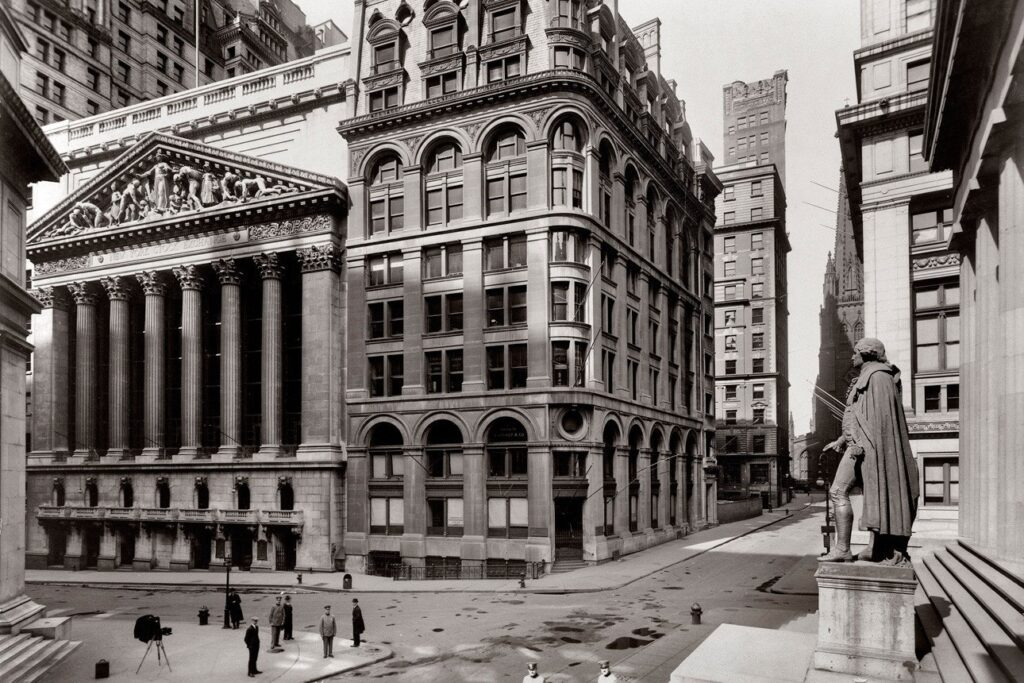
I cannot fail to mention two great names in technical analysis. One of them is Edson Gould, who by 1930 was already selling subscriptions to his newsletter for $500, and he remains one of the longest-lived traders, having successfully traded until the late 1980s.
Another prominent figure who was still active was John Magee, co-author of the 1948 classic, “Technical Analysis of Stock Trends,” and was one of the first to trade exclusively based on stock prices. He was so disciplined that he refused even to read the newspaper to avoid corrupting his chart analysis.
The 1950’s: From Wall Street to the World
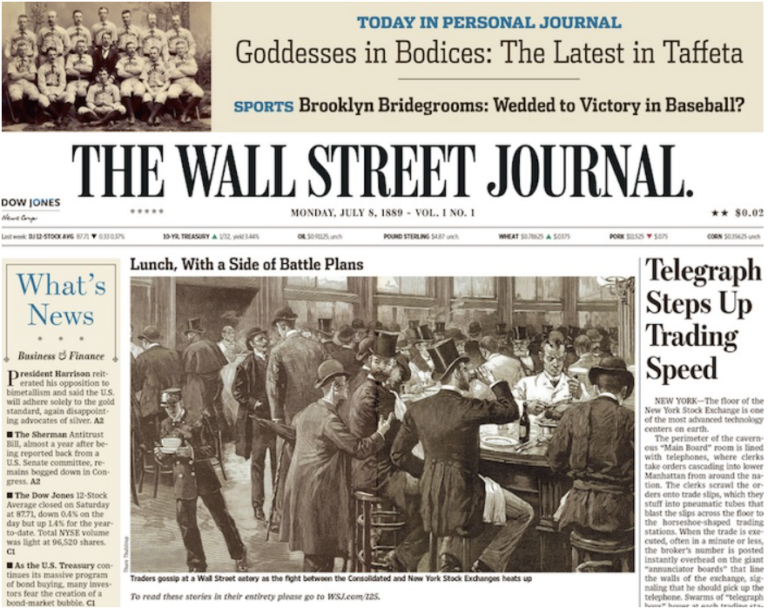
In the 1950s, technical analysis stepped out of its native sphere, from brokerage firms and financial newspapers on Wall Street, and reached banks, academia, and individual retail investors. The use of price charts and technical indicators became widespread among traders and researchers, legitimizing all the tools formulated in the previous decades.
The discipline evolved from a field based on mere visual observation of charts to a more structured field, incorporating principles of mathematics, collective psychology, and statistics.
During this time, the stochastic oscillator was developed, the first of the major indicators that would become popular over time. It compares the current closing price with the price range over a period and helps identify divergences and overbought and oversold conditions.
This oscillator was created by George Lane and his team, an academic and futures trader in Chicago, who epitomizes this period when technical analysis began to spill over into new arenas, and new techniques and indicators started to emerge.

The Technological Revolution of the 1960’s
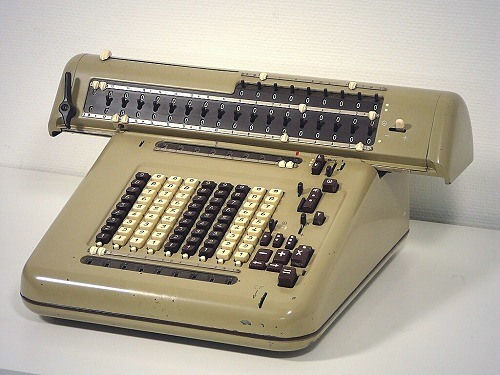
During the 1960s, the impact of technology on technical analysis became increasingly evident. In the early 20th century, price and volume data were manually recorded on paper charts. Later, electromechanical calculators allowed for the faster calculation of oscillators and indices. In the 1960s, new machines enabled the plotting of prices on charts on a large scale.
This era also saw the emergence of the first computers, which revolutionized technical analysis by enabling the processing of large volumes of data in real-time. The use of technology paved the way for significant tools to be included in the trader’s arsenal in the following decades, such as:
1. Moving averages, which smooth out market noise to better identify trends, and became popular during this time.
2. On Balance Volume (OBV), created by Joseph Granville in the 1960s to assess the relationship between price and volume and its influence on market trends.
3. Relative Strength Index (RSI), developed by Welles Wilder Jr. in 1978, which measures the speed and strength of price changes to identify divergences and overbought and oversold conditions.
4. Moving Average Convergence Divergence (MACD), created by Gerard Appel in 1979, which combines short and long-term moving averages to identify the strength of a trend and generate buy and sell signals.
5. Bollinger Bands, formulated by John Bollinger in the 1980s, which consist of a central moving average with two volatility bands, an indicator that gained popularity over time.
The Greatest Traders of the 1970s
The 1970s were a very challenging environment in the financial market, with high inflation and oil shocks increasing volatility in global markets, which sparked greater interest in price prediction methods. Concepts such as cycle analysis and price patterns emerged during this time, aiming to identify recurrences and regularities in market movements.
The use of technology also enabled more efficient and precise analysis of specific markets, such as futures and options. Traders like Paul Tudor Jones and Stanley Druckenmiller achieved remarkable performances with technical analysis strategies during this period.
I have a 45-minute video where I explore the trading philosophy of the greatest traders of all time, such as Paul Tudor, Druckenmiller, Jeff Yass, Larry Hite.

The Reagan-Thatcher Era
The 1980s marked the era of Reagan and Thatcher, where capitalism gained a brief respite to survive, as without it, we would all be servants of the state, living equally in misery while the rulers feast on lobster and Häagen-Dazs.
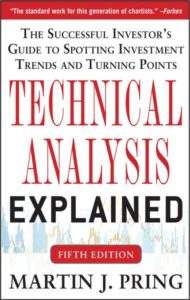
An indispensable figure from this era in our story is Martin Pring, who had the most impact on me, being responsible for the foundation that led me to create numerous videos and articles on technical analysis. In 1980, he published the work “Technical Analysis Explained,” considered the Bible of technical analysis, covering everything from basic principles to advanced strategies, and continues to be one of the most important sources of knowledge in technical analysis.
I want to mention one more author here before we move on to the 1990s, and that is John Murphy, who also played a significant role in popularizing technical analysis. His most renowned work, “Technical Analysis of the Financial Markets,” is a major reference for its clear and didactic approach, explaining complex concepts in an accessible manner.
The Diffusion of Knowledge in the 1990s
Here we are in the 1990s, the era of Tamagotchis and Game Boys. But when it comes to technical analysis, this is the moment when the popularization of internet-connected trading platforms is gaining more and more popularity among small investors.
Some works from this period already give an idea of how technical analysis was now geared towards smaller traders, such as:
– “Trading for a Living” by Alexander Elder, still in 1993;
– “Street Smarts,” a book by Linda Raschke from 1996; and
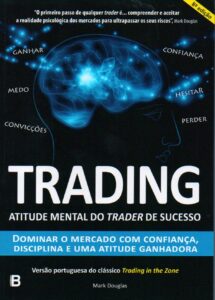
– “Trading in the Zone” by Mark Douglas, from the year 2000.
The 1990s were the time when you would go to the newsstand to buy music magazines, computer games, and study materials for exams. A global symbol of this era in technical analysis is Trader Oliver Vélez, who popularized this knowledge through study materials, seminars, and training sessions.
Marcio Noronha: Technical Analysis Arrives in Brazil
In Brazil during the 1990s, the biggest reference, the person who contributed the most to the dissemination of technical analysis among Brazilians, was Marcio Noronha, nicknamed The Father of Technical Analysis in Brazil. I had the honor of recording an interview with Marcio on the channel.
Marcio Noronha had been active in the market since the 1960s, but in the 1980s, he ended up leading a more rural life, growing lettuce on a farm in Teresópolis. When he needed money to pay for his wife’s dental treatment, he realized that selling lettuce wouldn’t be financially viable. Marcio was friends with the biggest speculator in Rio de Janeiro at that time, Alfredo Grumser, who traded Vale do Rio Doce. “It was him in Rio and Naji Nahas in São Paulo.”
To summarize the story, Marcio returned to the market with a bang by making a term operation in Vale do Rio Doce that earned him $19,000 in profit in 3 weeks. About a month later, Marcio returned all the profit. But at least he was back in the market and had contact with a guy named Peter, who came from England and knew about technical analysis. Let’s remember that this was 1984, in Brazil nobody took technical analysis seriously at that time. Marcio dedicated himself to studying, and in 1994 he decided to write a basic book on technical analysis.
In 1998, he founded the Timing publishing house, and the name came from a technical analysis book that the Englishman named Peter introduced him to. Marcio Noronha realized the huge gap in the country in this area, where not even the great classics had been translated into Portuguese, and he took the reins of history, translating the greatest books on technical analysis into Portuguese, allowing this knowledge to spread throughout Brazil.
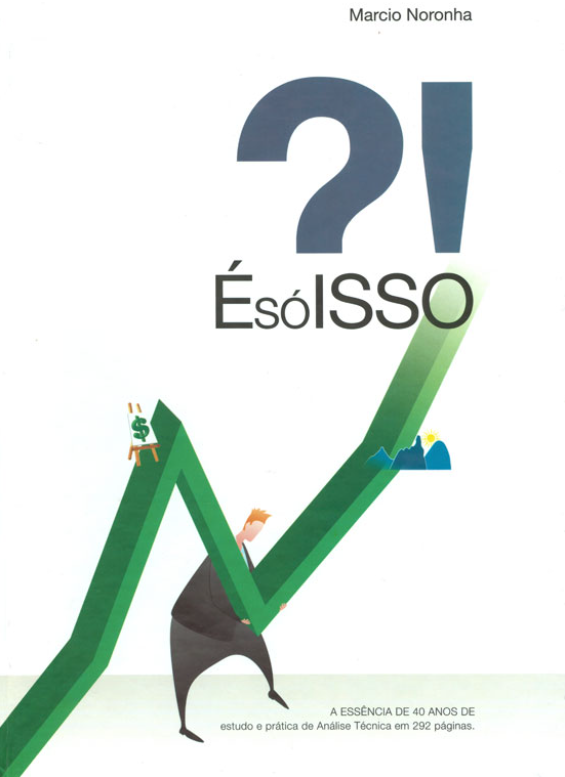
Over the years, reaching the 2000s, Marcio taught what he knew in courses and study materials, and it was through accumulating the biggest doubts of the students that he was able to write his masterpiece, the book ‘That’s it’. Without Marcio Noronha’s work, you would have to be fluent in English to learn technical analysis. So, I take this opportunity to thank Marcio on behalf of the entire trading community in Brazil.
2000s: The Era of Trading Platforms
In the 2000s, trading platforms emerged that we still use today, such as MetaTrader, developed with the Trader’s needs in mind, offering many tools and indicators. Brokerages also escalated the use of algorithms in buying and selling operations in fractions of a second, known as High-Frequency Trading (HFT).
2010: The Trader Community
From 2010 onwards, the most striking development is the emergence of the trader community. Although forums existed before, now all human interaction was shifting to social media platforms like Facebook and Twitter in the 2000s, and Telegram and Discord in the 2010s. In fact, these technology companies became the most valuable in the world during this time, surpassing centuries-old oil and industrial giants.
During this period, we still have prominent masters of technical analysis publishing books, such as:
– Alexander Elder and Linda Raschke, focusing on the psychology of trading;
– Thomas Bulkowsky and Steve Nison, covering candlestick patterns;
– John Murphy and Martin Pring, two fundamental authors in technical analysis.
This is also the time of the greatest Price Action author, Al Brooks, with a method based on the primacy of price, and the leading representative of this method in Brazil, Felippe Aranha, who also has an interview with me.

2020: Free Content and Zero Fees
Today, technical analysis is more accessible than ever, with abundant free material available on YouTube. Trading platforms have evolved significantly, and brokerage fees have been eliminated, making this the ideal time for anyone looking to dive into the world of technical analysis.
I offer highly educational classes covering key topics in Technical Analysis here in the Central and on the YouTube channel. Be sure to check them out:



2 Responses