How to read candlestick charts FROM SCRATCH (no complication)
How to Read Candlestick Charts from Scratch (Without Complication) If you are starting in the financial markets, there is one
How to Read Candlestick Charts from Scratch (Without Complication) If you are starting in the financial markets, there is one
Learn how market cycles influence stocks, currencies, commodities, and crypto.
A complete explanation of Dow Theory and how traders can apply it in day trading.

A complete guide to understanding moving averages in trading.
Financial Volume: Why Price Lies Without Volume (and How This Changes Your Trading) Without volume, price can fool you. And
A complete guide to advanced support and resistance, explaining how supply and demand shape price behavior, market structure, Fibonacci levels, volume, timeframe hierarchy and technical confluence.

Samuel Benner’s 150-year-old chart predicted every crash and now signals 2026 as the best year to sell stocks.
Learn how to apply the Fibonacci strategy across two timeframes to trade more consistently and identify key market reversals.
Learn how the 200-period moving average works as a powerful day trading strategy for timing entries and managing trends.
Master Fibonacci trading with retracements and projections — from beginner to advanced — to find high-probability setups.
Learn the best candlestick patterns to identify entry signals in day trading and improve accuracy in your trades.
Stock Market Crash Course – Lesson 2: Risk, Return, and Diversification Hello everyone! Let’s continue our free stock market course
Stocks are fractions of a company and the most traditional way to get rich in financial markets. Learn how to invest with the new Free Stocks Course with The Market Guy.
ETFs can be the fastest and easiest way to invest wisely — if you know how to choose the right assets for your goals.
The 3 most lucrative broadening patterns leave a cue on when to enter the trade
Discover how price movements reflect the market’s supply and demand, guiding you to spot trends and key levels. This introductory lesson covers candlesticks, support, resistance, and the basic steps for confident decision-making in trading.
Leverage in day trading can multiply both profits and losses, demanding strict control. This definitive lesson shows how to manage margin, lot sizes, and stop orders for safer positions.
Starting with little capital doesn’t have to mean taking on massive risk. This guide shows how to set daily loss limits, adapt lot sizes, and place stops effectively for safer day trading.
Learn how to choose technical indicators that truly assist in decision-making for day trading, avoiding common mistakes and optimizing your strategy
Check out how to operate the powerful Flag pattern, one of the best continuation formations in trading
The 100% Fibo target is a strategic point in trading, signaling a possible reversal or profit realization
Explore the basics of technical indicators in this free day trading course. Perfect for beginners looking to enhance their trading strategies with practical tools.
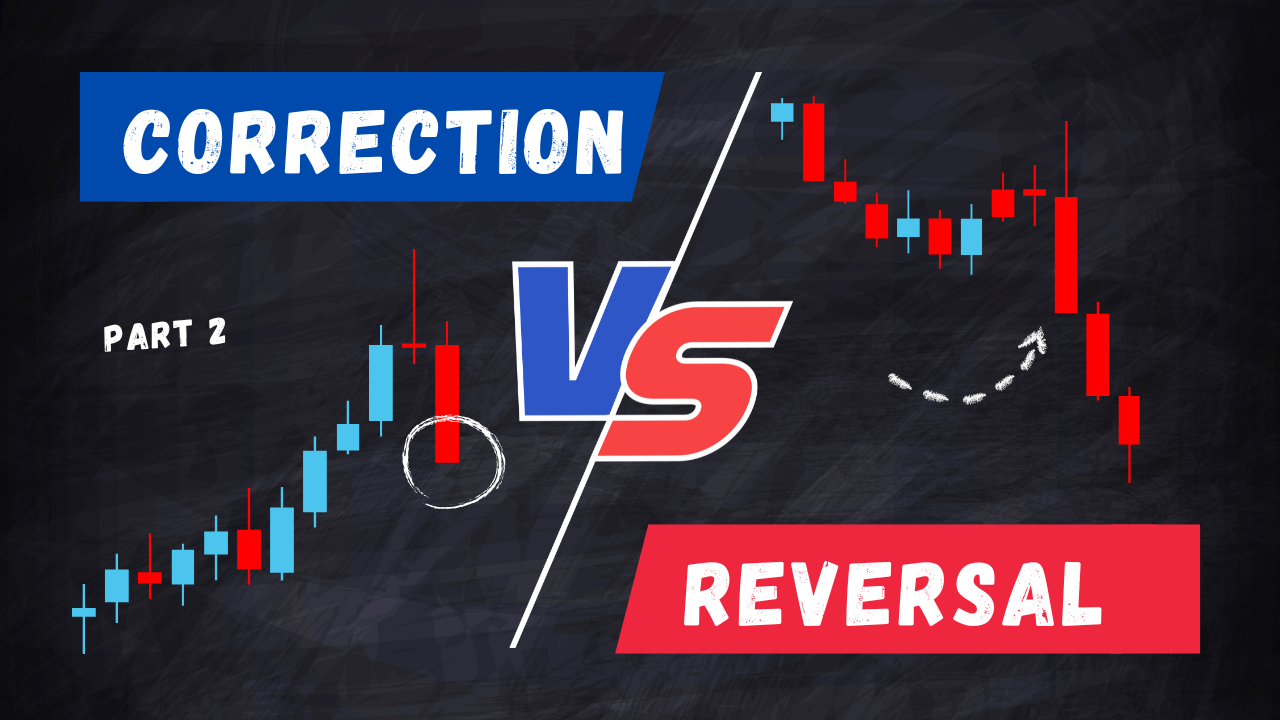
See how to identify Correction and Reversal in the market trend and how to trade each of these movements
Part 2 of the Introduction to trading and graphic analysis for beginners, step by step, from scratch
The essential fundamentals you need to know to start trading using technical analysis and trend-following strategies
Discover the difference between a correction and a reversal in the financial market and learn how to identify these movements using technical indicators
Knowing how to choose and calibrate the best moving average for day trade, swing and position allows us to identify the trend of the market and reduce noise
The heatmap can show with more clarity the performance of companies and sectors in a given period
The moving-average crossover can be an effective strategy with you know how to calibrate the moving averages for day trade and position
Gaps indicate a reversion of the trend, but they last for a short time
Investing at market highs: when to jump in and when to avoid
The Elephant Bars Setup by Oliver Velez offers great assertiveness but a big stop
The 3 main types of order is at market, limited and stop, each with a different purpose
There are 3 professional ways to trade breakouts of the trend lines, and each form will use a different type of order
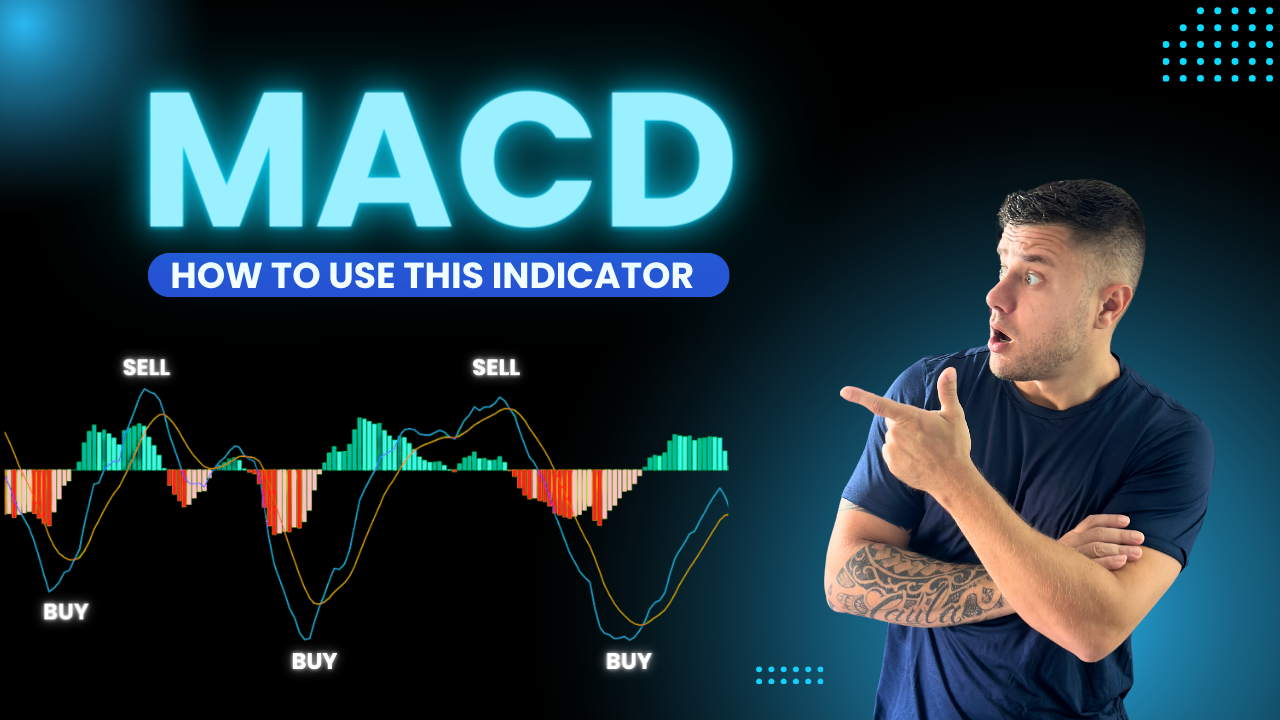
One of the most popular indicators among traders is MACD, which shows the divergence to the average
The Gift consists of a corrective candle after a directional movement, and it is a real gift for traders
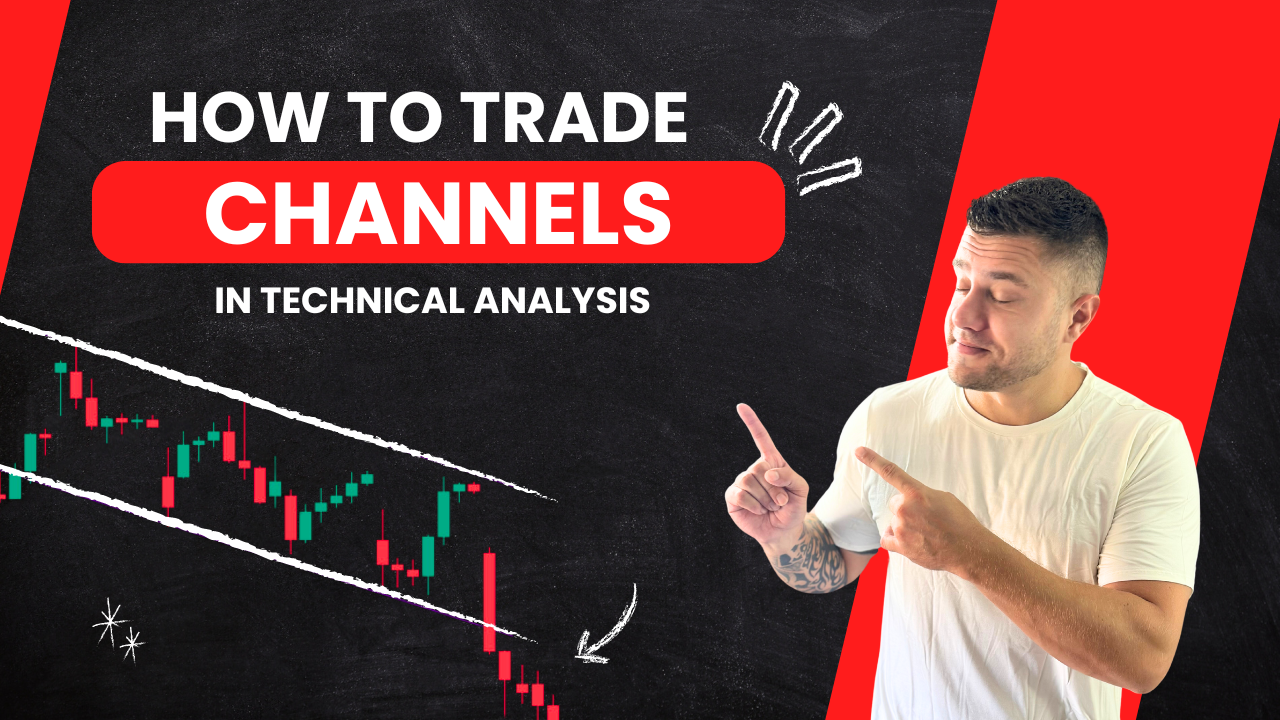
The uptrend or downtrend channel is formed by two parallel trendlines, and a trader needs to know how to operate it

B3 has just launched its Bitcoin Futures Contract and I asked Lucas Costa from Bank BTG how to trade it
The moving average helps us read the market trends with less noise

For beginners, investing in Cryptocurrency though the Bank BTG Pactual may be the most advantageous option
There are 4 indicators that every trader needs to know
The RSI (Relative Strength Index) is the most important momentum indicator in trading.
Momentum is one of the Most Important Concepts in Technical Analysis
The Advance-Decline Line (ADL) is the Primary Market Breath Indicator

Understanding Algorithms Today is Fundamental for Every Trader
The VWAP (Volume-Weighted Average Price) is one of the Few Indicators that a Trader Should Use
The OBV (On-Balance Volume) is a Volume Indicator that Precedes Price and Can Be Used in Various Ways
Indices Aggregate the Price of Various Assets and are the Benchmark for Profitability
Hand Size is one of the Crucial Elements for Success in the Market
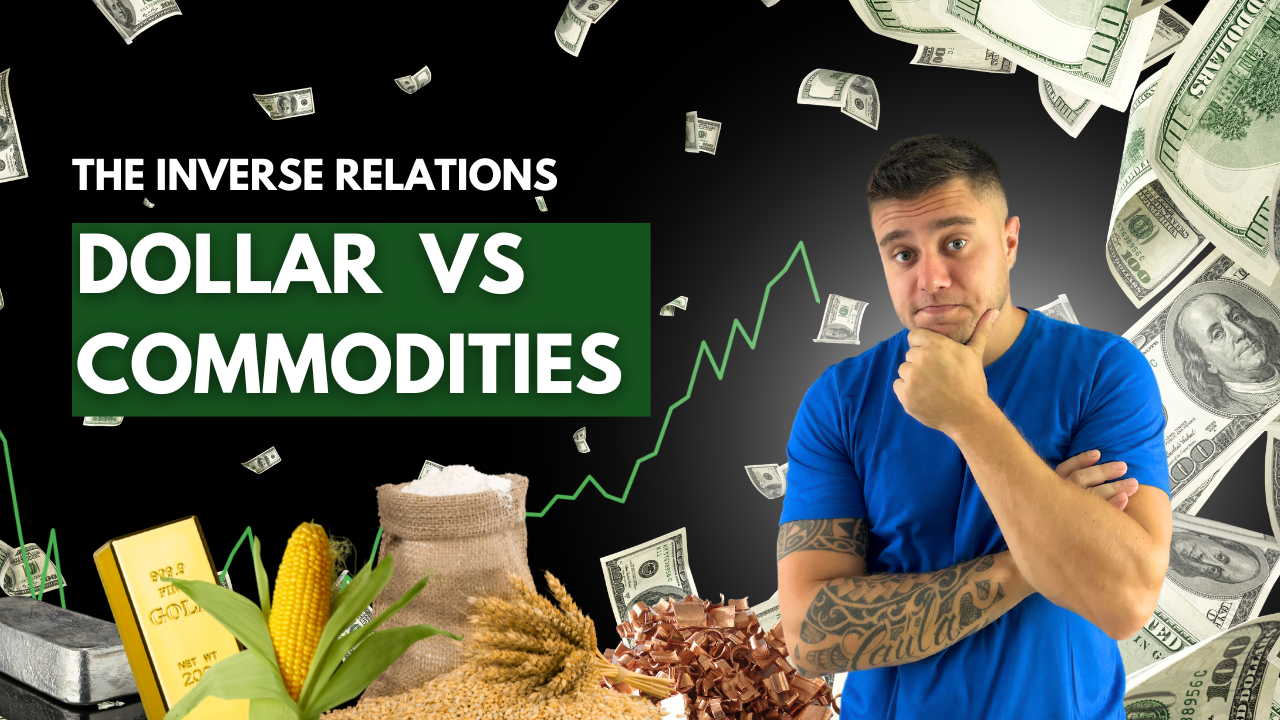
Understanding Why the Dollar and Commodities Move in Opposite Directions is Fundamental
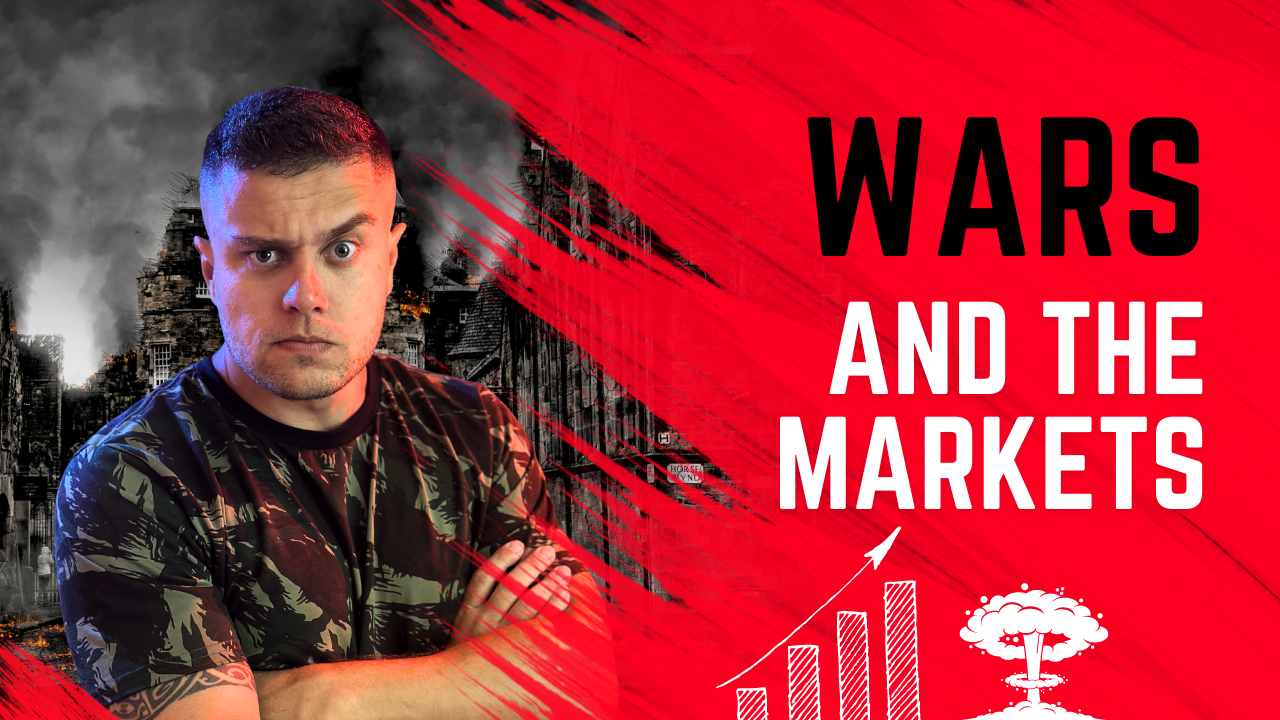
Wars are the Geopolitical Factors that Most Impact the Stock Market

John Murphy is one of the Leading Experts on How to Trade Various Markets
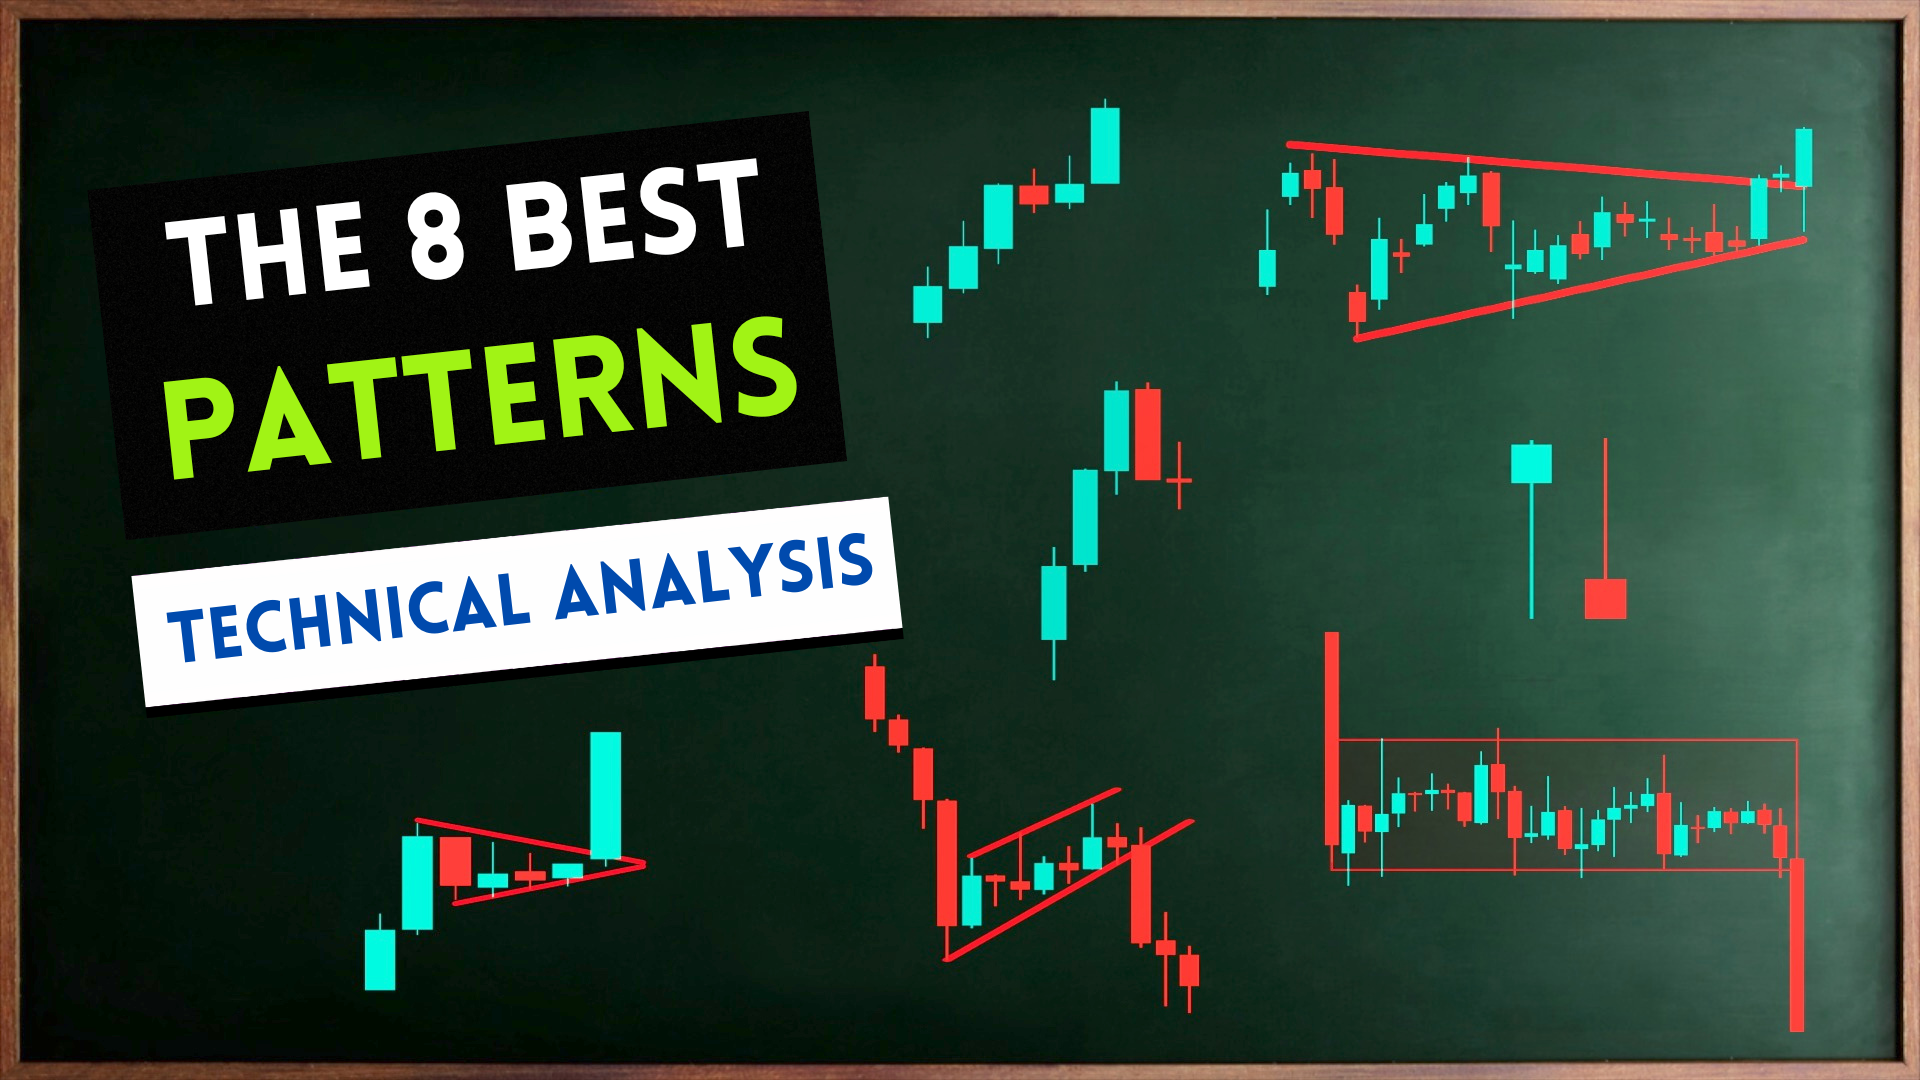
Chart Patterns are the Best Signals the Market Leaves for Those Who Want to Make Money
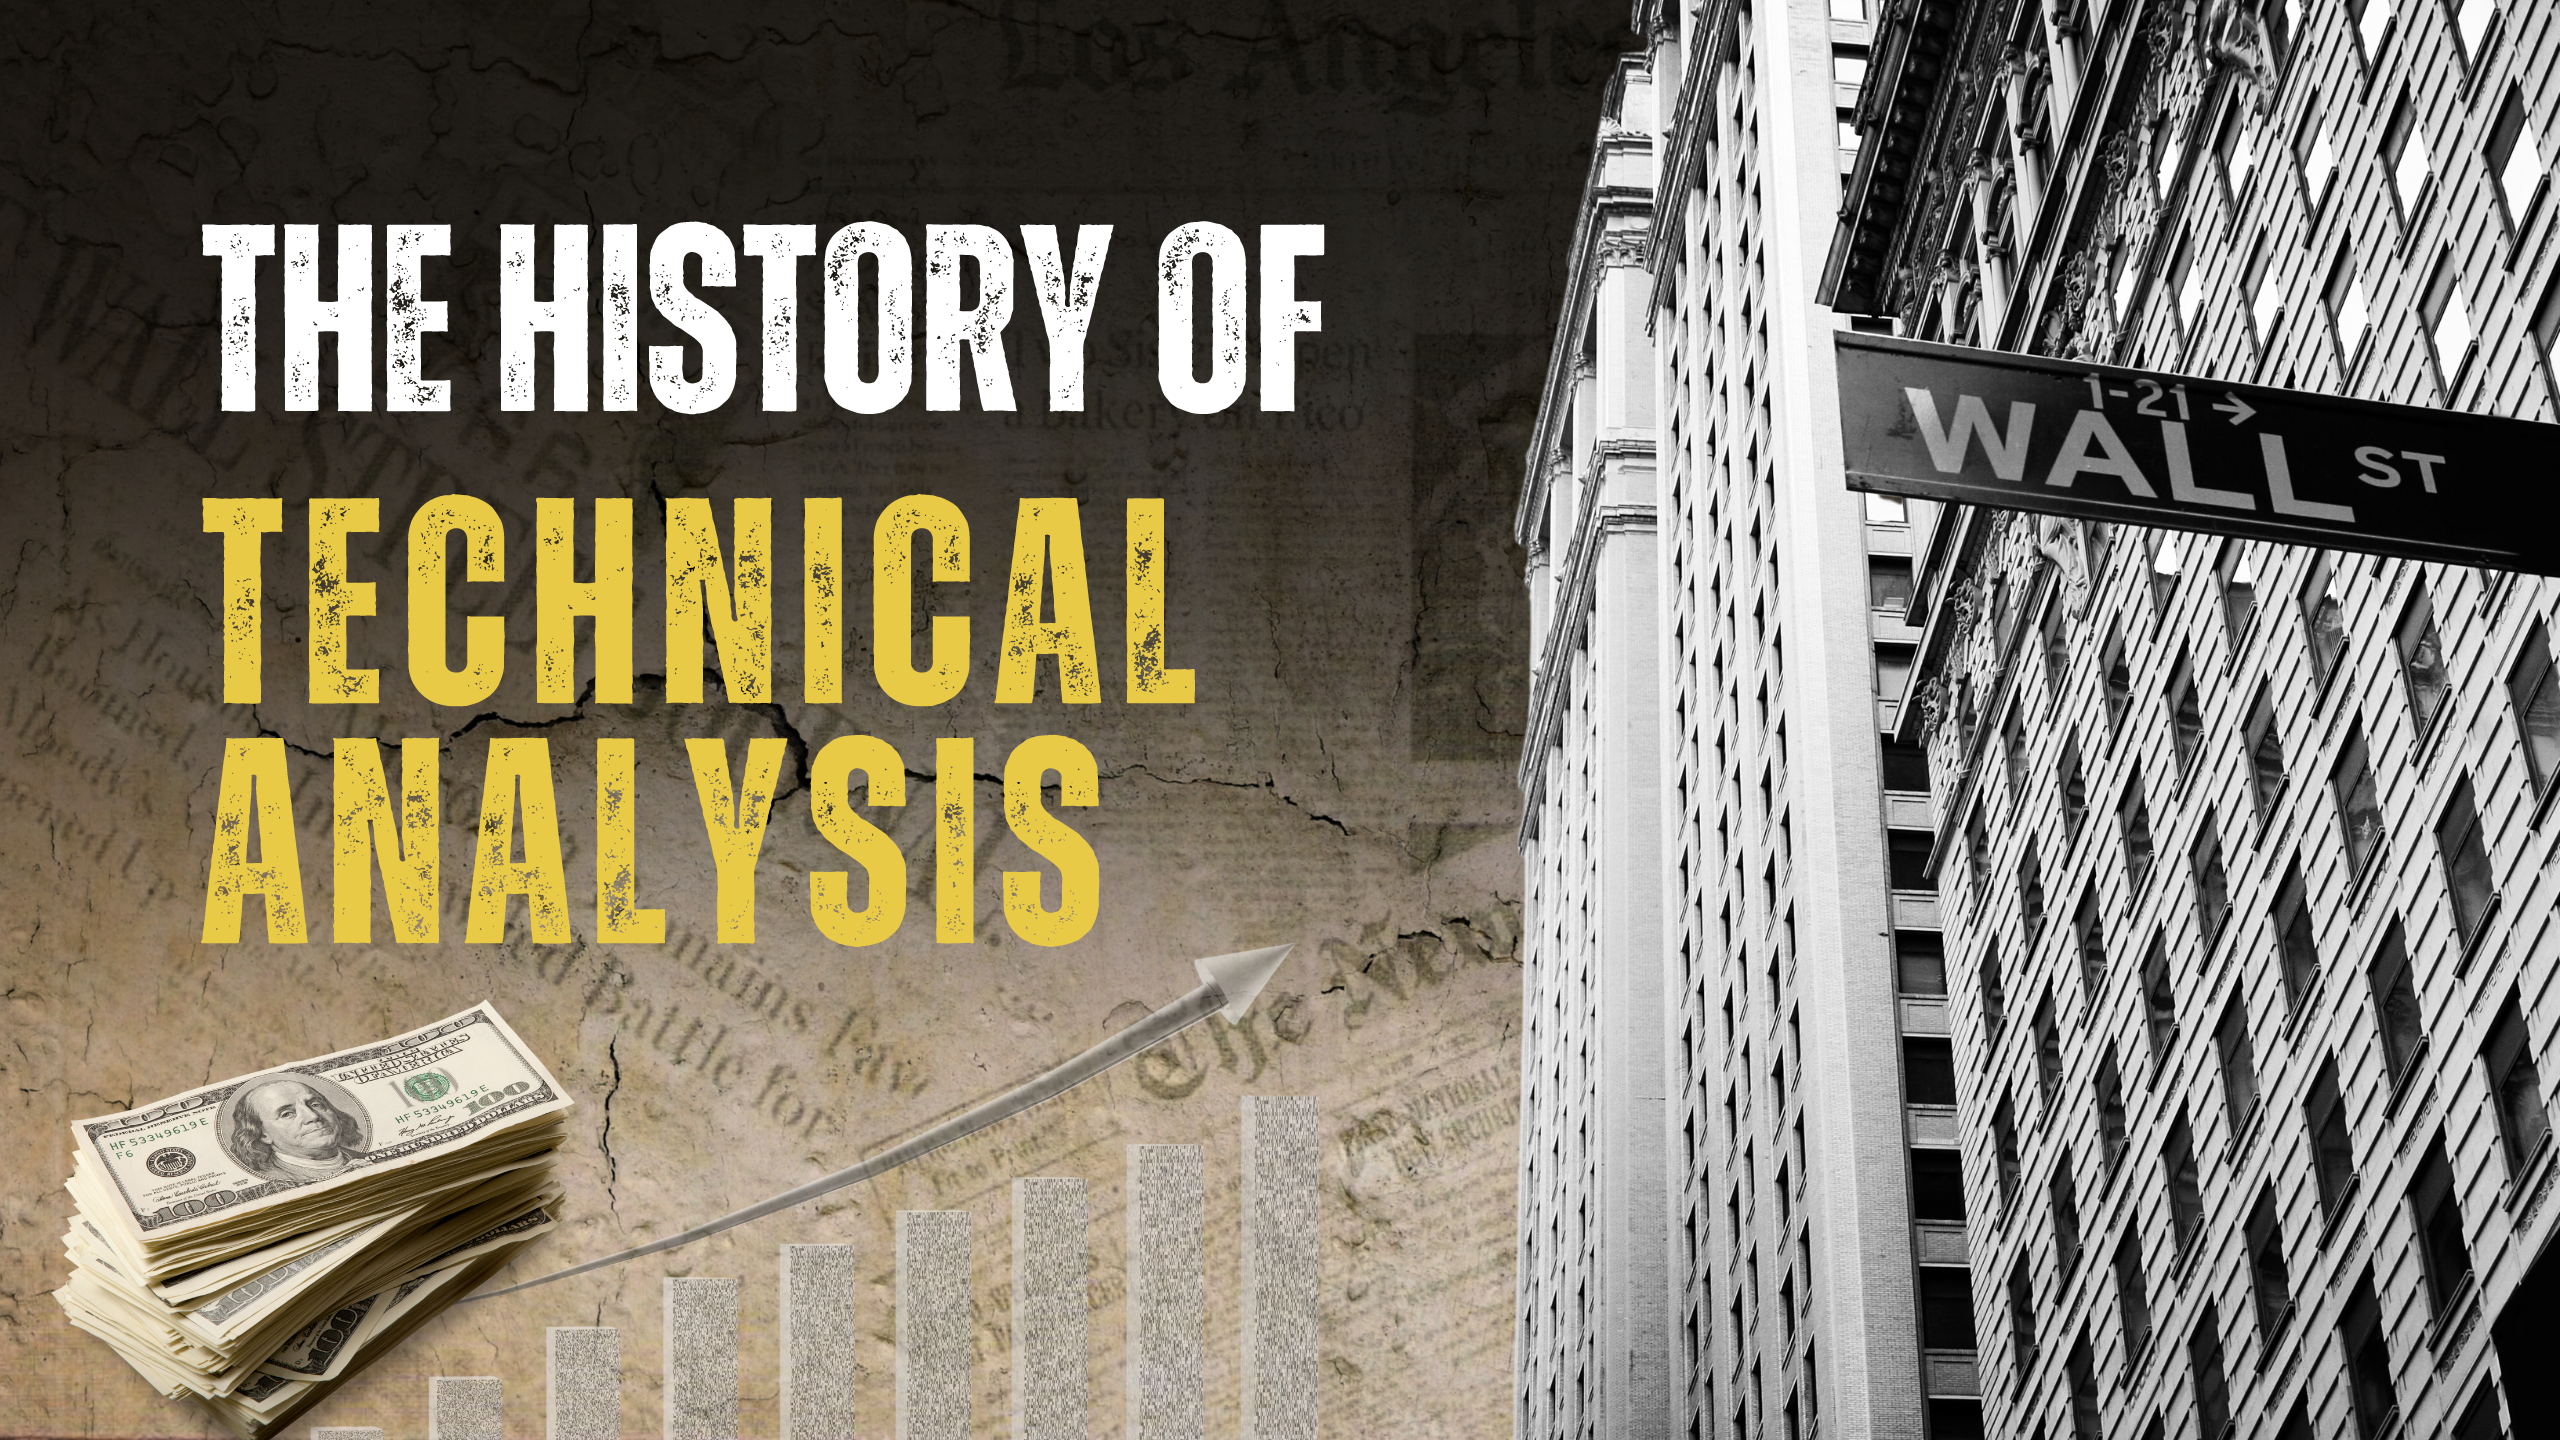
Technical Analysis Emerged in the Late 19th Century and Today is Applied by All Brokerages Worldwide
Price Action and Technical Analysis Are the 2 Approaches You Need to Know If You Want to Be a Trader
Leonardo Fibonacci was one of the Greatest Mathematicians in History and Every Trader Needs to Know Him
Technical Analysis is the Chart Evaluation Method You Need to Master If You Want to Be a Trader