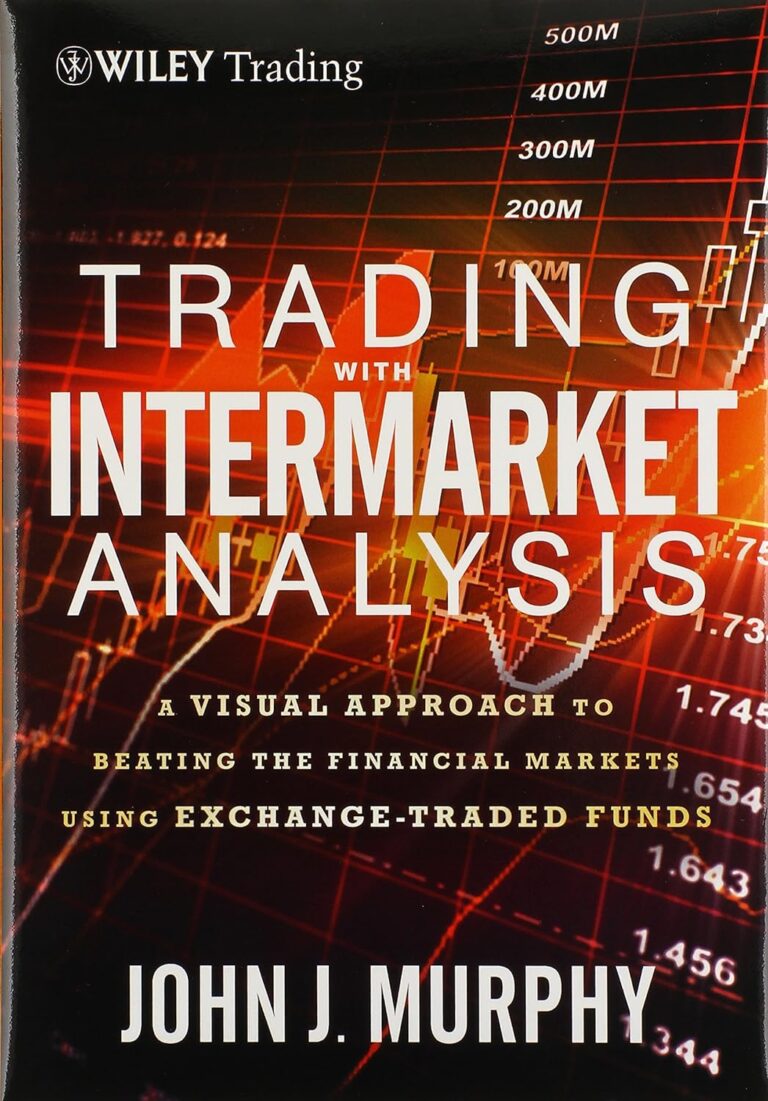
The dollar and commodities move in opposite directions, which is what we refer to in the market as negative correlation. In this article, we’ll delve deeper into this inverse relationship between the dollar and commodities, with my reference being John Murphy from the book ‘Intermarket Technical Analysis: Trading Strategies for the Global Stock, Bond, Commodity, and Currency Markets.’
In summary, John Murphy explains that all markets are somehow related, so we should always keep an eye on other markets that have a connection to the one we are trading. For example, those trading mini-futures indices also look at mini-dollar futures.
In the case of commodities and the dollar, they are markets that, in John Murphy’s words, have “one of the most consistent and reliable intermarket relationships” (1st paragraph, page 135), and that’s why we’ll delve deeper into this inverse relationship.
Understanding Correlations
A correlation between two markets can be positive or negative. Positive correlation occurs when these two markets move in the same direction most of the time. For example, if the American stock market is rising, usually the Brazilian stock market will also rise, unless an internal issue in the country momentarily breaks that correlation.
But they tend to move together, hence the positive correlation. In the case of negative correlation, it refers to two markets that move in opposite directions, as is the case with the dollar and commodities.
Throughout the inflationary decade of the 1970s, the decline of the dollar contributed to a significant increase in commodity prices. Between 1970 and 1990, all major changes in commodity prices were preceded or coincided with a turnaround in the direction of the US dollar.

Always Observing Both Markets
And what does that mean for you if you want to invest or engage in day trading or swing trading? It means that since these two markets are closely linked, they should be analyzed together. Planning to trade commodities?
You have to keep an eye on the dollar on another screen, or split the screen in half, or overlay one chart on top of the other, which I’ll show you here. The point is, keep one eye on the fish, and the other on the cat. The author of this book even goes so far as to say that it’s a mistake to analyze one without the other.
Any commodity, except gold, should be analyzed with an eye on the dollar. And then you might ask, “Why not gold?” The explanation is in Chapter 11: “Gold does not always act like other commodities because of its additional role as an alternative currency. Gold is not only the strongest commodity in the world. It is also the strongest currency in the world.”

The Dollar as a Leading or Lagging Indicator
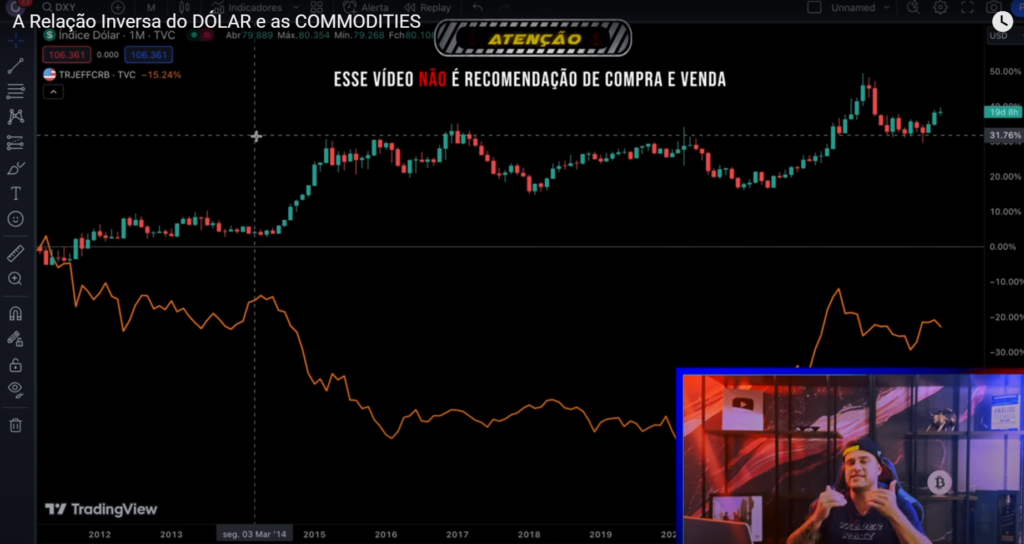
Check out this chart: the candlestick chart represents the dollar, and the orange line represents the commodity index, the CRB. Notice the alligator mouths opening, starting here on September 1, 2014.
Now, take a look at this quote on page 136: “the dollar often changes direction before commodities do, and when that happens, it becomes a valuable indicator that commodity prices are likely to change direction.” In these situations, the dollar has acted as a leading indicator, meaning it precedes changes, because there are also lagging indicators, such as moving averages.
A quick note, whether it’s long-term investments or day trading or swing trading, we do it through BTG Pactual, a partner here on the channel, so when you’re done reading, sign up with BTG.

In Practice: The Commodities Boom of 2002
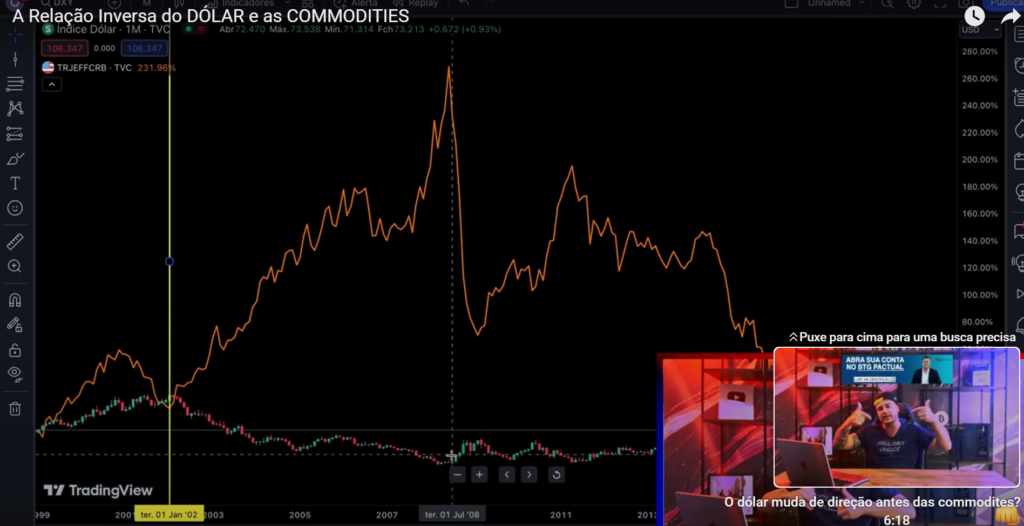
Now, let’s take a look at that commodities boom starting from 2002 on the chart.
This inverse relationship between the dollar and commodities is first linked to the laws of supply and demand. We have to understand that some commodities that make up this CRB index in orange, like oil and copper, are “closely linked to the dynamism of the economy,” in the words of Jonh Murphy himself.
So, if these commodities, which are important for the economy, such as oil and copper, are falling, it reveals a weakening of the global economy. You’ll even see stocks falling alongside, and the dollar rising. But then, I recommend reading my article “15 Tips from John Murphy,” where I explain the issue of the market’s direction change for stocks and commodities, as one usually changes direction a few months before the other.
Check out the video I made about Dollar vs. Commodities:
>> See also:


One Response